Advanced Plant Ecology · Ecosystem Structure and Functions
A forest, a pond and a grassland look very different. Yet all three run on the same basic pattern: green plants capture sunlight, animals eat plants or each other, and fungi and bacteria return dead material to the soil and water. To understand any ecosystem, an ecologist must ask two questions: what is it made of? (structure) and how does energy move through it? (function).
This lesson explains ecosystem structure, introduces the two great channels of energy flow in the Y-shaped model, and works through the ten percent law — including why 10% is a rough average, not a fixed rule of nature.
Learning objectives
- Define an ecosystem and separate its abiotic and biotic components.
- Describe producers, consumers and decomposers, and place organisms in trophic levels.
- Distinguish the grazing food chain from the detritus food chain, and explain how the Y-shaped model connects them.
- Apply the ten percent law to calculate energy at each trophic level, and explain where the lost energy goes.
- Explain why 10% is an average and why food chains rarely have many trophic levels.
1. What is an ecosystem?
An ecosystem is a community of organisms together with the physical environment they interact with, studied as one working system. The community is the living part: all the populations of different species in a place. The physical environment supplies light, water, air, minerals and a surface to live on. What makes the whole thing an ecosystem is the interaction: organisms change their environment, and the environment shapes which organisms can live there.
The term ecosystem was introduced by the British ecologist Arthur Tansley in 1935. He wanted a word that kept organisms and their environment together, because studying one without the other misses how nature actually works.
An ecosystem has no fixed size. A single pond is an ecosystem. So is a forest, a desert, or the whole biosphere — the thin zone of Earth where life exists. The boundary is chosen by the question being asked. A researcher studying nutrient recycling in a lake draws the boundary around the lake and its shores. A researcher studying a river catchment draws a much larger one. State the boundary and the time period, because both affect what the measurements mean.
| Level | What is included? | Example question |
|---|---|---|
| Population | Individuals of one species in a specified area. | How many oak seedlings survived this year? |
| Community | Populations of different species considered together. | Which plants grow beneath the oak canopy? |
| Ecosystem | The community plus its physical environment and the exchanges of energy and materials between them. | How do fallen leaves return nutrients to the soil? |
| Biome | A large region with a similar climate and similar vegetation, made of many ecosystems. | How does a tropical rainforest differ from a desert? |
For the community-level foundation behind this lesson, see Plant Community Characteristics & Ecological Succession.
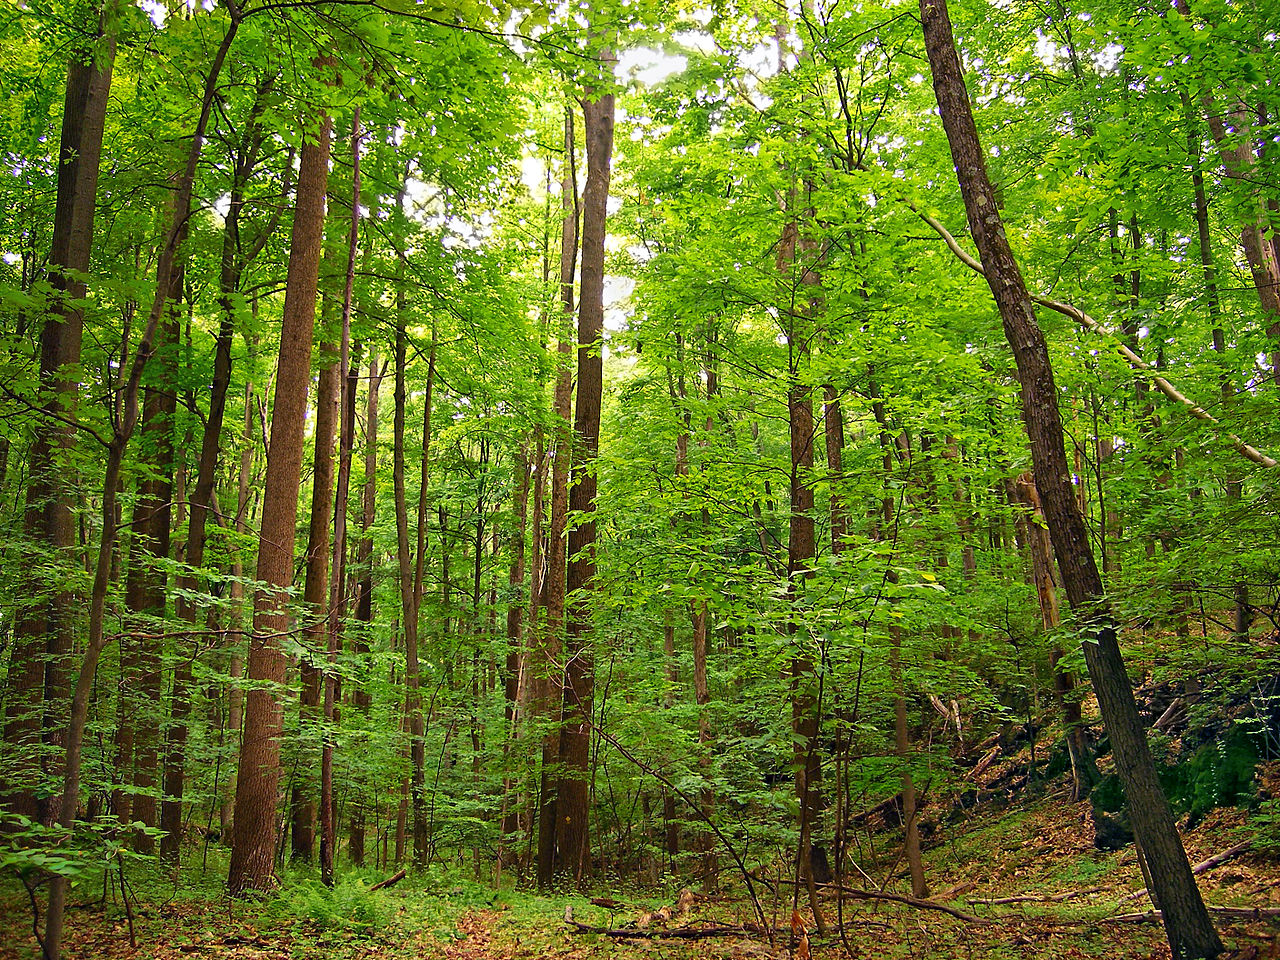

2. Ecosystem structure: the abiotic and biotic components
Structure means what an ecosystem is made of, and how its parts are arranged. Ecologists usually divide structure into two groups of components: abiotic (non-living) and biotic (living).
2.1 Abiotic components
Abiotic components are the physical and chemical factors of the environment. They set the conditions for life, even though they are not alive themselves.
| Abiotic component | What it includes | Why it matters |
|---|---|---|
| Light | Sunlight: intensity, duration and quality (wavelength) | The energy source for nearly all ecosystems; drives photosynthesis |
| Temperature | Air, water and soil temperature; daily and seasonal range | Controls the rate of chemical reactions and which species can survive |
| Water | Rainfall, humidity, soil moisture, water currents | Required by all life; carries nutrients and shapes habitats |
| Air and gases | Oxygen, carbon dioxide, nitrogen in air and dissolved in water | Oxygen for respiration; carbon dioxide for photosynthesis; nitrogen for proteins |
| Soil and minerals | Soil texture and structure, pH, mineral nutrients such as nitrogen, phosphorus and potassium | Supplies nutrients to plants; holds water; anchors roots |
| Topography | Slope, aspect (direction a slope faces), altitude | Affects light, drainage, temperature and soil depth |
These factors do not act alone. A south-facing slope in the northern hemisphere receives more light and is warmer and drier than a north-facing slope nearby. The same rainfall supports different vegetation on sandy soil, which drains fast, and on clay soil, which holds water. Always describe abiotic factors together, not one at a time.
2.2 Biotic components: producers, consumers and decomposers
Biotic components are the organisms. They are grouped by how they obtain energy, not by what they look like. This functional grouping is what makes energy-flow diagrams possible.
Producers (autotrophs) make their own food. Green plants, algae and cyanobacteria use photosynthesis: they capture light energy and store it as chemical energy in sugars. A small number of bacteria are chemosynthetic — they obtain energy from chemical reactions, for example around deep-sea vents — but in nearly all ecosystems on land and in sunlit water, photosynthesis is the entry point for energy.
Consumers (heterotrophs) obtain energy by eating other organisms, living or dead. They include:
- Herbivores (primary consumers), which eat producers: a deer eating grass, a caterpillar eating a leaf, zooplankton grazing on algae.
- Carnivores (secondary and higher consumers), which eat other animals: a fox eating a rabbit, a ladybird eating aphids.
- Omnivores, which eat both plant and animal material: many birds, bears and humans.
- Detritivores, which eat dead organic matter (detritus): earthworms, woodlice and many insect larvae. They shred dead leaves and dung, which speeds up decomposition.
- Parasites, which obtain energy from a living host, usually without killing it quickly: mistletoe on a tree, a tapeworm in an animal gut.
Decomposers — mainly bacteria and fungi — break down dead organic matter chemically. They release nutrients back into the soil and water in forms that producers can absorb again. Without decomposers, nutrients would stay locked in dead leaves and dead animals, and plant growth would slow to a stop.
Note the difference between detritivores and decomposers: a detritivore eats dead material; a decomposer chemically breaks it down from outside, absorbing the products. Both belong to the detritus channel described in Section 5, and in practice they work together.


2.3 Trophic levels: feeding positions
A trophic level is a feeding position in an ecosystem: how many steps energy has taken from the producers. The word comes from the Greek trophe, meaning food or nourishment.
| Trophic level | Who is here | Example |
|---|---|---|
| Level 1 | Producers | Grass, oak tree, pond algae |
| Level 2 | Primary consumers (herbivores) | Grasshopper, deer, zooplankton |
| Level 3 | Secondary consumers (small carnivores) | Frog eating insects, small fish eating zooplankton |
| Level 4 | Tertiary consumers (larger carnivores) | Snake eating frogs, large fish eating small fish |
| Level 5 (rare) | Top carnivores | Eagle, lion, shark |
Two cautions. First, trophic level is a functional position, not a fixed identity. An omnivore such as a crow feeds at more than one level: it is a primary consumer when it eats seeds and a secondary consumer when it eats insects. Second, decomposers and detritivores do not sit neatly on one level, because they feed on dead material from all levels. Diagrams often draw them to one side, with arrows arriving from every level. Both points matter when you read real food webs, which are covered in the next post in this series.
3. Ecosystem functions: energy flow and nutrient cycling
If structure is what an ecosystem is, function is what an ecosystem does. Two functions matter most:
- Energy flow — the movement of energy from sunlight, through producers and consumers, and out of the ecosystem as heat. Energy flows in one direction. It is not recycled.
- Nutrient cycling — the movement of chemical elements such as carbon, nitrogen and phosphorus between organisms and the environment, again and again. Nutrients are recycled: the same nitrogen atom may pass through a plant, a herbivore, a decomposer and the soil many times.
This difference — energy flows through, nutrients cycle round — is one of the most important ideas in ecology. It is also why ecosystems need a constant input of energy (almost always sunlight) but can run for a long time on a limited supply of nutrients, as long as decomposers keep returning them. Biogeochemical cycles are covered in detail in a later post in this series; here, keep the contrast in mind: one-way energy, circular nutrients.
3.1 Productivity: how much energy is captured?
Productivity is the rate at which producers capture energy. Three terms are used, and exams test the difference between them:
- Gross primary productivity (GPP) is the total rate at which producers capture light energy by photosynthesis, over a stated area and time (for example, kJ m⁻² yr⁻¹).
- Respiration (R) is the energy producers use for their own life processes: growth, maintenance, transport and repair. Much of it is released as heat.
- Net primary productivity (NPP) is what remains for growth and for consumers: NPP = GPP − R.
Only NPP is available to herbivores and to the detritus channel. A fast-growing plant in bright light may have a high GPP, but if it also respires heavily — for example, on a hot night — its NPP is lower than the GPP suggests. When this lesson's worked example starts with "10,000 units" at the producer level, it means net production available to the next level, not the total sunlight arriving. In many ecosystems only about 1% of the solar energy arriving is fixed as chemical energy by photosynthesis; the rest is reflected, passes through leaves, arrives at wavelengths plants cannot use, or is lost as heat. The exact fraction varies with vegetation, season and latitude, so treat 1% as a rough guide, not a constant.
4. Two food chains: grazing and detritus
A food chain is a single sequence showing who eats whom: grass → grasshopper → frog → snake. Real feeding relationships form webs, not single chains, but chains are a useful starting point because they show the direction of energy flow clearly.
There are two fundamentally different kinds of food chain, and most ecosystems contain both:
- The grazing food chain starts with living producers. Example: grass → deer → wolf. Energy moves from living plant tissue to herbivore to carnivore.
- The detritus food chain starts with dead organic matter. Example: fallen leaves → earthworms and fungi → beetles and birds that eat the worms. Energy moves from dead material to detritivores and decomposers, and then to their predators.
In a forest, a large share of plant production is never eaten alive. Leaves fall, trees die, and roots decay underground — so the detritus chain carries a great deal of energy. In a grassland, grazing animals eat much more of the living plant material, so the grazing chain is relatively more important. In open water, tiny algae are grazed quickly by zooplankton, so the grazing chain dominates there too. These are general patterns, not fixed rules: the balance varies between ecosystems and between seasons.
5. The Y-shaped model of energy flow
The Y-shaped model (also called the two-channel or Y-shaped energy flow model) was developed by the American ecologist Eugene P. Odum. It shows the two food chains as the two arms of a letter Y, joined at the base by the producers.
Picture the letter Y:
- The stem of the Y is the producers. All energy in the system enters here, through photosynthesis.
- The left arm is the grazing food chain: living producers → herbivores → carnivores.
- The right arm is the detritus food chain: dead organic matter → detritivores and decomposers → their predators.
- Arrows connect the arms. Dead bodies and faeces from the grazing chain fall into the detritus chain. Predators in the grazing chain eat animals from the detritus chain, and decomposers release nutrients that producers absorb again.
The Y shape makes three ideas visible that a single straight chain hides:
- Energy has two routes, not one. A leaf may be eaten alive by a caterpillar (grazing route) or fall to the ground and be broken down by fungi (detritus route). Both routes move energy, and both end with predators and decomposers.
- The routes are connected. The arms of the Y are not separate ecosystems. A bird that eats earthworms links the detritus arm to the grazing arm. A dead herbivore feeds the detritus arm. Nutrients released by decomposers feed the producers at the base.
- The balance between the arms differs between ecosystems. In a forest, the detritus arm is large because so much plant material dies uneaten. In a grassland or a plankton community, the grazing arm is larger. A good Y diagram therefore shows the two arms with different widths for different ecosystems — the model is a framework, not a fixed picture.


5.1 Reading a Y diagram in an exam
When you are given a Y-shaped diagram, work through it in this order:
- Find the producers at the base. All energy enters here.
- Follow the grazing arm: producer → herbivore → carnivore. Note what is eaten alive.
- Follow the detritus arm: dead matter → detritivore/decomposer → predator. Note what dies or is egested.
- Find the connecting arrows: dead bodies, faeces and fallen leaves moving from the grazing arm to the detritus arm; predators eating across both arms; nutrients returning to producers.
- Compare the arms: which arm is wider, and what does that tell you about this ecosystem?
A common exam error is to describe the two arms as if they were two separate ecosystems. They are not. The whole point of the Y model is that one ecosystem has two connected channels.
6. Energy flow is one-way, and most energy is lost at each step
Energy enters an ecosystem as light, is stored briefly as chemical energy in food, and leaves as heat. It does not come back. This follows the second law of thermodynamics: in every energy transfer, some energy becomes heat that spreads out and cannot be used again for work in the system. That is why ecosystems need a constant supply of sunlight, while nutrients can be recycled.
At each transfer from one trophic level to the next, energy is lost in several ways:
| Where the energy goes | What happens | Example |
|---|---|---|
| Respiration | Energy is used for movement, growth, repair and keeping warm, and released as heat | A deer uses most of the energy in the grass it eats just to stay alive and move |
| Egestion | Food that is eaten but not digested leaves the body as faeces | Undigested plant fibre in herbivore dung |
| Excretion | Waste products from metabolism carry energy away | Urea in urine |
| Uneaten material | Parts of organisms are never eaten at all | Roots, bones, bark, fallen leaves |
| Death and decay | Energy in dead bodies passes to decomposers, not to the next trophic level | A dead fish broken down by bacteria |
Only the energy that is converted into new biomass at one level — and then eaten — is available to the next level. Everything else is lost as heat, passed to the detritus chain, or never eaten. That is why each trophic level contains far less energy than the one below it.
7. The ten percent law
The ten percent law states that, on average, only about 10% of the energy at one trophic level is transferred to the next trophic level. The other 90% is lost, mainly as heat through respiration, or passes to decomposers.
The idea comes from Raymond Lindeman's classic 1942 study of Cedar Bog Lake in Minnesota, USA. Lindeman measured the energy flowing through the lake's trophic levels and found that the transfer between levels was roughly one tenth. Later work in many ecosystems confirmed that a figure near 10% is a useful rough average — but it is an average, not a law of physics. The next section explains why.
7.1 Worked example: energy through four trophic levels
The numbers below are an illustrative teaching example, not measurements from a real ecosystem. They use exactly 10% transfer at each step so the pattern is easy to follow. Energy is given in kilojoules per square metre per year (kJ m⁻² yr⁻¹).
| Trophic level | Organisms | Energy available | Calculation |
|---|---|---|---|
| Level 1 | Producers (grass) | 10,000 kJ m⁻² yr⁻¹ | Starting point: net production |
| Level 2 | Primary consumers (grasshoppers) | 1,000 kJ m⁻² yr⁻¹ | 10,000 × 0.10 = 1,000 |
| Level 3 | Secondary consumers (frogs) | 100 kJ m⁻² yr⁻¹ | 1,000 × 0.10 = 100 |
| Level 4 | Tertiary consumers (snakes) | 10 kJ m⁻² yr⁻¹ | 100 × 0.10 = 10 |
Check the pattern: each level holds one tenth of the level below it. After three transfers, the top level holds 10 out of the original 10,000 units — that is 0.1% of the producers' energy. This is the main reason food chains are usually short: after four or five levels, there is simply not enough energy left to support another population of predators.
Try it yourself. Producers in an illustrative grassland fix 50,000 units of net energy. At 10% transfer, how much energy reaches trophic level 3? Level 2 receives 50,000 × 0.10 = 5,000 units. Level 3 receives 5,000 × 0.10 = 500 units.
7.2 Why 10% is a rule of thumb, not a fixed law
Real transfer efficiencies vary. The proportion of energy transferred between two levels is called ecological efficiency (or trophic transfer efficiency). Measured values in real ecosystems are often roughly 5% to 20%, depending on the organisms and conditions:
- Herbivores eating plants often have low efficiency, because plant material contains much indigestible cellulose and lignin. A caterpillar may transfer only about 5–10% of the energy in the leaves it eats.
- Carnivores eating animals often have higher efficiency, because animal tissue is easier to digest and closer in composition to the predator's own body. Efficiencies of 15–20% are common.
- Aquatic plankton systems can show high efficiency, because tiny algae are eaten whole and have little indigestible material.
- Warm-blooded animals (birds and mammals) lose more energy as heat to maintain body temperature, so they transfer less to the next level than cold-blooded animals of similar size.
So when a question says "apply the ten percent law", use 10% as instructed — but in a discussion answer, always add that 10% is an average, that real values range roughly from 5% to 20%, and that the exact figure depends on the organisms involved. A student who writes "exactly 10% is transferred in every ecosystem" has misunderstood the concept.
7.3 What the ten percent law explains
The ten percent law explains several patterns you can observe in nature:
- Few trophic levels. Most food chains have three to five levels. A sixth level would receive about 0.001% of the producers' energy in our worked example — too little to support a viable population.
- Top predators are rare. Because so little energy reaches the top, top predators have small populations and need large territories. A lion population needs a huge area of grassland and a large herbivore population beneath it.
- Eating lower on the food chain feeds more people. The same area of farmland supports far more people if the crop is eaten directly than if it is fed to animals first, because each extra trophic level loses about 90% of the energy. This is an energy argument, not a complete argument about diet — protein quality, land type and culture also matter — but the energy logic is real.
- Biomagnification is not explained by the ten percent law. Harmful substances such as some pesticides become more concentrated at higher levels, because they are stored in fat and are not broken down. Energy decreases up the chain; these persistent chemicals increase. Do not confuse the two patterns.
8. Active learning: interpret the evidence
Task 1. A student draws a food chain with eight trophic levels, each holding 10% of the level below. What is wrong?
After seven transfers, the eighth level would hold 10,000 × 0.10⁷ = 0.001 units from a starting 10,000 units. That is far too little energy to support a population. Real food chains rarely exceed five levels because of energy loss.
Task 2. A forest diagram shows a very wide detritus arm and a narrow grazing arm. What does this tell you?
Most plant production in this forest dies uneaten and enters the detritus chain as fallen leaves, dead wood and roots. Grazing animals eat only a small share of the living production. The Y model lets you read this balance at a glance.
Task 3. A lake study reports a transfer efficiency of 18% between algae and zooplankton, but only 6% between grass and caterpillars on land. Is one measurement wrong?
Not necessarily. Algae are eaten whole and are easy to digest, while grass contains much indigestible fibre. Transfer efficiency varies with the organisms involved; 10% is an average, and real values often fall roughly between 5% and 20%.
9. Misconceptions to correct
- "Energy is recycled like nutrients." Energy flows one way: sunlight in, heat out. Nutrients cycle; energy does not.
- "Exactly 10% is transferred in every ecosystem." Ten percent is a rough average. Real ecological efficiencies often range from about 5% to 20%.
- "Decomposers are a trophic level above the top predators." Decomposers feed on dead material from all levels. They are usually drawn separately, with arrows arriving from every level.
- "The grazing and detritus chains are separate ecosystems." They are two connected channels in one ecosystem, joined at the producers and linked by death, faeces, predation and nutrient recycling.
- "Plants produce energy." Plants do not create energy. They capture light energy and store it as chemical energy. Energy is transferred and transformed, never created.
- "Lost energy disappears." Lost energy is not destroyed. It leaves the system as heat that cannot be used again by the ecosystem. The total energy in the universe is conserved; the usable energy in the ecosystem is not.
- "All the energy in food a herbivore eats goes to the next level." Most is used in respiration, egested as faeces, or lost in other ways. Only the fraction converted to new biomass and then eaten reaches the next level.
10. Quick revision summary
An ecosystem is a community plus its physical environment, interacting as one system. Its structure has abiotic components (light, temperature, water, gases, soil and minerals, topography) and biotic components grouped by how they obtain energy: producers, consumers and decomposers. Organisms occupy trophic levels according to how many feeding steps they are from the producers.
Ecosystem function has two great processes: energy flows one way through the system and out as heat, while nutrients cycle between organisms and the environment. Only net primary productivity (GPP minus respiration) is available to consumers.
The Y-shaped model shows energy entering through producers and splitting into two connected channels: the grazing food chain (living producers eaten by herbivores and carnivores) and the detritus food chain (dead matter broken down by detritivores and decomposers). The arms are linked by death, faeces, predation and nutrient recycling, and their relative sizes differ between ecosystems.
The ten percent law says that, on average, about 10% of the energy at one trophic level reaches the next. The rest is lost through respiration, egestion, excretion, uneaten material and death. Ten percent is a rough average — real efficiencies often range from about 5% to 20% — and energy loss is why food chains are short and top predators are rare.
11. Frequently asked questions
What is the difference between a community and an ecosystem?
A community is all the populations of different species living together in a place. An ecosystem is the community plus its physical environment and the interactions between them, including energy flow and nutrient cycling.
Are decomposers consumers?
Decomposers are heterotrophs, so in the broadest sense they consume organic matter. But they are usually treated as a separate group because they break down dead matter chemically from outside, rather than eating living organisms. In diagrams they are drawn separately, receiving material from all trophic levels.
Why does the Y-shaped model have two arms?
Because energy leaves the producers by two routes: living tissue eaten by herbivores (the grazing arm) and dead tissue broken down by detritivores and decomposers (the detritus arm). The Y shows both routes and their connections in one picture.
Is the ten percent law always true?
No. It is a useful average based on Lindeman's 1942 study and later measurements. Real transfer efficiencies vary, often roughly between 5% and 20%, depending on the organisms and the ecosystem. Use 10% when a question instructs you to, and describe it as an average in discussion answers.
Why are there no food chains with ten trophic levels?
Because each transfer loses about 90% of the energy. After many transfers, the remaining energy is too small to support a population. Most food chains have three to five levels.
Where does the lost energy actually go?
Mostly it is released as heat during respiration. Some leaves in faeces and urine, some stays in uneaten parts such as roots and bones, and some passes to decomposers. The energy is not destroyed; it becomes heat that the ecosystem cannot use again.
12. Twenty explained MCQs
Choose an answer before opening each explanation. Every question is drawn from the content of this post.
1. Which definition best describes an ecosystem?
- All the populations of one species in an area
- A community of organisms together with the physical environment they interact with
- All the non-living factors of a habitat, studied separately from organisms
- A group of ecosystems with a similar climate
Show answer and explanation
Answer: B. An ecosystem is the community plus its physical environment, studied as one interacting system. Option A describes a population; option D describes a biome.
2. Who introduced the term "ecosystem" in 1935?
- Raymond Lindeman
- Eugene P. Odum
- Arthur Tansley
- Charles Darwin
Show answer and explanation
Answer: C. Arthur Tansley introduced the term ecosystem in 1935, to keep organisms and their environment together in one concept.
3. Which of the following is an abiotic component of an ecosystem?
- A decomposer fungus
- Soil pH and mineral content
- A herbivore population
- A detritivore community
Show answer and explanation
Answer: B. Soil pH and minerals are non-living chemical factors. Fungi, herbivores and detritivores are biotic (living) components.
4. Producers are best defined as organisms that:
- Eat other living organisms for energy
- Break down dead organic matter chemically
- Make their own food, usually by photosynthesis
- Eat dead organic matter
Show answer and explanation
Answer: C. Producers (autotrophs) make their own food, usually by photosynthesis. Option B describes decomposers and option D describes detritivores.
5. Which pair correctly separates detritivores from decomposers?
- Detritivores photosynthesise; decomposers eat living prey
- Detritivores eat dead material; decomposers break it down chemically
- Detritivores are always fungi; decomposers are always animals
- Detritivores and decomposers do exactly the same job
Show answer and explanation
Answer: B. A detritivore such as an earthworm eats dead material, while a decomposer such as a fungus or bacterium breaks it down chemically from outside and absorbs the products.
6. In a grazing food chain — grass → grasshopper → frog → snake — the frog occupies which trophic level?
- Level 1
- Level 2
- Level 3
- Level 4
Show answer and explanation
Answer: C. Grass is level 1 (producer), the grasshopper is level 2 (primary consumer), and the frog, which eats the grasshopper, is level 3 (secondary consumer).
7. An omnivore such as a crow is difficult to place on exactly one trophic level because:
- It is a producer
- It feeds at more than one trophic level
- It never eats other animals
- It is a decomposer
Show answer and explanation
Answer: B. An omnivore eats both plant and animal material, so it acts as a primary consumer when eating seeds and as a secondary consumer when eating insects.
8. Which statement correctly contrasts energy flow and nutrient cycling?
- Both energy and nutrients are recycled indefinitely
- Energy flows one way through an ecosystem; nutrients cycle between organisms and the environment
- Nutrients flow one way; energy cycles
- Neither energy nor nutrients leave an ecosystem
Show answer and explanation
Answer: B. Energy enters as sunlight and leaves as heat, while nutrients such as nitrogen and phosphorus are used again and again.
9. Net primary productivity (NPP) is calculated as:
- GPP + respiration
- GPP − respiration
- Respiration − GPP
- GPP × respiration
Show answer and explanation
Answer: B. NPP = GPP − R. Only the energy remaining after the producers' own respiration is available for growth and for consumers.
10. In the Y-shaped model of energy flow, the stem of the Y represents:
- The top carnivores
- The decomposers
- The producers
- The detritus
Show answer and explanation
Answer: C. All energy enters the system through the producers at the base (stem) of the Y, then splits into the grazing and detritus arms.
11. Which sequence belongs to the detritus food chain?
- Grass → deer → wolf
- Algae → zooplankton → small fish
- Fallen leaves → earthworms and fungi → birds that eat the worms
- Seeds → mice → owls
Show answer and explanation
Answer: C. The detritus chain starts with dead organic matter. Options A, B and D start with living producers, so they are grazing chains.
12. In a forest, the detritus arm of the Y is usually large because:
- Forests have no herbivores
- Most plant material dies uneaten as fallen leaves, dead wood and roots
- Fungi photosynthesise in forests
- Forests receive no sunlight
Show answer and explanation
Answer: B. In a forest, a large share of plant production is never eaten alive, so much energy enters the detritus chain as dead material.
13. Which of these is a connection between the two arms of the Y?
- Sunlight reaching only the grazing arm
- Dead bodies and faeces from the grazing chain entering the detritus chain
- Producers eating decomposers
- Carnivores producing their own food
Show answer and explanation
Answer: B. Death and egestion move material and energy from the grazing arm into the detritus arm. The arms are connected, not separate.
14. Using the ten percent law, if producers hold 10,000 units of energy, how much energy reaches trophic level 4?
- 1,000 units
- 100 units
- 10 units
- 1 unit
Show answer and explanation
Answer: C. Level 2 receives 10,000 × 0.10 = 1,000; level 3 receives 100; level 4 receives 10 units.
15. In the worked example, producers hold 10,000 kJ m⁻² yr⁻¹ and primary consumers hold 1,000 kJ m⁻² yr⁻¹. How much energy is lost in this one transfer?
- 1,000 kJ m⁻² yr⁻¹
- 9,000 kJ m⁻² yr⁻¹
- 10,000 kJ m⁻² yr⁻¹
- 100 kJ m⁻² yr⁻¹
Show answer and explanation
Answer: B. 10,000 − 1,000 = 9,000 units are lost, mainly as heat through respiration, plus egestion, excretion and uneaten material. That is 90% of the producers' energy.
16. Producers fix 50,000 units of net energy. At 10% transfer, how much energy reaches trophic level 3?
- 5,000 units
- 500 units
- 50 units
- 50,000 units
Show answer and explanation
Answer: B. Level 2 receives 50,000 × 0.10 = 5,000 units, and level 3 receives 5,000 × 0.10 = 500 units.
17. If trophic level 3 holds 40 units of energy and transfer efficiency is 10% at each step, how much energy did the producers hold?
- 400 units
- 4,000 units
- 40,000 units
- 4 units
Show answer and explanation
Answer: B. Working backwards: level 2 held 40 ÷ 0.10 = 400 units, and level 1 held 400 ÷ 0.10 = 4,000 units.
18. At a transfer efficiency of 20%, producers holding 8,000 units would pass how much energy to trophic level 2?
- 800 units
- 1,600 units
- 3,200 units
- 400 units
Show answer and explanation
Answer: B. 8,000 × 0.20 = 1,600 units. Higher efficiency transfers more energy, which is why real efficiencies matter.
19. Which statement about the ten percent law is most accurate?
- Exactly 10% is transferred between every pair of trophic levels in every ecosystem
- Ten percent is a rough average; real efficiencies often range from about 5% to 20%
- The law applies only to aquatic ecosystems
- The law was proposed by Arthur Tansley in 1935
Show answer and explanation
Answer: B. Ten percent is an average from Lindeman's 1942 study and later work. Real values vary with the organisms involved, often roughly between 5% and 20%.
20. Food chains rarely have more than five trophic levels mainly because:
- Top predators eat too slowly
- About 90% of the energy is lost at each transfer, leaving too little for further levels
- Producers stop photosynthesizing after level 5
- Decomposers block energy from reaching higher levels
Show answer and explanation
Answer: B. Repeated 90% losses leave very little energy at high levels — in the worked example, only 0.1% of the producers' energy reaches level 4 — so further levels cannot support viable populations.
Sources and further study
The definitions, models and worked examples in this lesson follow standard university ecology texts. The teaching numbers are illustrative; the concepts and their history are as follows.
- Tansley, A. G. (1935). The use and abuse of vegetational concepts and terms. Ecology, 16, 284–307. Introduced the term "ecosystem".
- Lindeman, R. L. (1942). The trophic-dynamic aspect of ecology. Ecology, 23, 399–417. The Cedar Bog Lake study behind the ten percent law.
- Odum, E. P. (1971). Fundamentals of Ecology (3rd ed.). W. B. Saunders. The Y-shaped (two-channel) model of energy flow.
- Begon, M., Townsend, C. R., & Harper, J. L. (2006). Ecology: From Individuals to Ecosystems (4th ed.). Blackwell. Trophic levels, productivity and transfer efficiency.
- Campbell, N. A., et al. Biology (current edition). Energy flow, primary productivity and ecological pyramids.
Continue your study: Plant Community Characteristics & Ecological Succession → this ecosystem lesson → next in this series: Food Webs and Ecological Pyramids. Return to Advanced Plant Ecology.
Reviewed for this draft on 18 November 2026. All photographs are real, openly licensed images with credits given under each figure. Teaching datasets and energy values are illustrative. Use your institution's current course outline to confirm assessment requirements.
0 Comments
Have a biology question or spotted an error?
Send feedback to PreachBio →