Quantifying Genetic Diversity
Plant Ecology II: Hardy–Weinberg equilibrium, diversity estimates, and the evolutionary processes shaping plant populations.
Introduction
Genetic diversity is variation in inherited genetic material within and among individuals and populations. It includes differences in alleles, genotypes, and DNA sequences.
A population with many plants does not necessarily contain high genetic diversity. It may have developed from only a few ancestors, or many visible shoots may belong to the same clone. Population size and genetic diversity therefore describe different aspects of a population.
Plant ecologists quantify genetic diversity to investigate breeding systems, isolation, population history, and conservation needs. These measurements also help explain how evolutionary processes change the genetic composition of populations.
1. Allele and Genotype Frequencies
An allele is a genetic variant at a locus. At a diploid locus with two alleles, A and a, individuals can have the genotypes AA, Aa, or aa.
- AA and aa are homozygous genotypes.
- Aa is a heterozygous genotype.
- Genotype frequency is the proportion of individuals with a genotype.
- Allele frequency is the proportion of copies represented by an allele.
Each diploid plant carries two copies of the locus. A sample of N plants therefore contains 2N allele copies.
p = frequency of A = (2 × number of AA + number of Aa) ÷ 2N
q = frequency of a = (2 × number of aa + number of Aa) ÷ 2N
For two alleles: p + q = 1
Worked example
A sample of 100 plants contains 40 AA, 40 Aa, and 20 aa. There are 200 allele copies in total.
p = (2 × 40 + 40) ÷ 200 = 0.60
q = (2 × 20 + 40) ÷ 200 = 0.40
The observed genotype frequencies are 0.40 AA, 0.40 Aa, and 0.20 aa.
These calculations count observed alleles and do not require Hardy–Weinberg equilibrium. The model is used to calculate expected genotype proportions.
2. Hardy–Weinberg Equilibrium
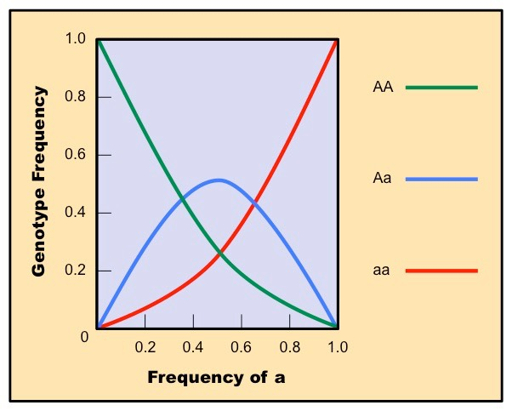
Hardy–Weinberg equilibrium is an ideal reference model. Under its conditions, allele frequencies remain constant across generations, while random mating produces predictable genotype frequencies.
AA = p²; Aa = 2pq; aa = q²
p² + 2pq + q² = 1
Conditions of the standard model
- Random mating with respect to the locus.
- A large population in which drift is negligible.
- No natural selection affecting the locus.
- No gene flow changing allele frequencies.
- No mutation changing the alleles considered.
Expected genotype counts
For the example above, p = 0.60 and q = 0.40:
| Genotype | Expected frequency | Expected count in 100 plants | Observed count |
|---|---|---|---|
| AA | 0.60² = 0.36 | 36 | 40 |
| Aa | 2 × 0.60 × 0.40 = 0.48 | 48 | 40 |
| aa | 0.40² = 0.16 | 16 | 20 |
Interpreting departures
Observed and expected counts may differ through sampling alone. Statistical tests help determine whether the difference is greater than expected by chance.
A departure does not automatically identify selection. Self-fertilization, population subdivision, sampling conditions, or genotyping errors may also contribute.
Non-random mating alone can change genotype proportions without immediately changing allele frequencies. A heterozygote deficit is therefore not, by itself, evidence of allele-frequency change through time.
3. Estimates of Genetic Diversity
Observed heterozygosity: HO
Observed heterozygosity is the proportion of sampled individuals that are heterozygous at a locus.
HO = number of heterozygotes ÷ number of individuals
In the example: HO = 40 ÷ 100 = 0.40
This measure describes observed genotypes. It is influenced by breeding system as well as allele frequencies.
Expected heterozygosity: HE
Expected heterozygosity, also called gene diversity, is the probability that two independently sampled allele copies differ. It equals expected heterozygosity under random mating in the standard diploid model.
For two alleles: HE = 2pq
HE = 2 × 0.60 × 0.40 = 0.48
For a locus with several alleles:
HE = 1 − sum of squared allele frequencies
If three alleles have frequencies 0.50, 0.30, and 0.20:
HE = 1 − (0.50² + 0.30² + 0.20²) = 0.62
The maximum of 0.50 applies only to a two-allele locus. A multiallelic locus can have higher expected heterozygosity.
Allele number and allelic richness
Allele number counts distinct alleles at a locus. Larger samples tend to reveal more rare alleles, so raw counts should not be compared carelessly.
Allelic richness standardizes allele-number comparisons to a common sampling level, commonly using rarefaction. It is particularly useful for detecting losses of rare variants after population reductions.
Percentage of polymorphic loci
This is the percentage of surveyed loci that contain variation under a stated criterion.
Polymorphic loci (%) = polymorphic loci ÷ total loci examined × 100
If 16 of 20 loci are polymorphic, the value is 80%. The marker panel and definition of polymorphism must be reported.
Nucleotide diversity: π
Nucleotide diversity is the average number of pairwise DNA differences per site. It considers sequence differences, rather than simply the number of alleles.
An average of 4 differences across 1,000 sites: π = 4 ÷ 1,000 = 0.004
Additional indices
- FIS summarizes heterozygote deficit or excess relative to the within-population expectation. A positive value does not prove inbreeding.
- FST describes genetic differentiation among populations. It is not a direct, assumption-free measurement of migration.
Why use several estimates?
Two populations can have similar heterozygosity but different numbers of rare alleles. Likewise, populations may each have low diversity but differ strongly from one another. Several measures provide a more complete picture.
4. Genetic Drift
Genetic drift is chance-driven change in allele frequencies. Because only a finite sample of alleles contributes to each generation, frequencies can change even when no allele provides a reproductive advantage.
Drift can cause an allele to become fixed, with frequency 1, or lost, with frequency 0. It generally erodes diversity within isolated populations over time.
Effective population size
Drift is stronger when effective population size, Ne, is small. This is the size of an idealized population with an equivalent amount of drift or inbreeding. It is not simply the number of visible plants.
Unequal reproductive success, population fluctuations, non-random mating, and clonal growth can make effective size differ from census size.
A meadow may contain many shoots, but if only a few genetic individuals produce most of the successful seeds, its effective population size may be much smaller than the shoot count suggests.
5. Bottlenecks and Founder Effects
Population bottlenecks
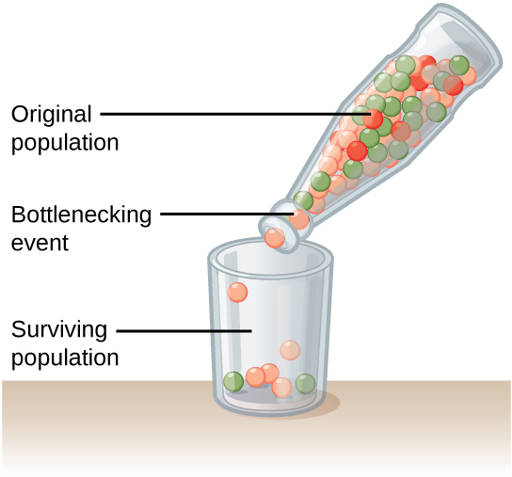
A bottleneck occurs when an existing population undergoes a sharp reduction. The survivors may retain only part of the original genetic variation.
Rare alleles are especially vulnerable. Even if plant numbers recover rapidly, the lost variants are not automatically restored.
Founder effects
A founder effect occurs when a small number of colonists establish a new population. Their allele frequencies may differ from those of the source population.
For example, a few seeds reaching an isolated habitat may carry only some of the alleles present in the original plant community.
A bottleneck reduces an existing population; a founder event establishes a new one. Both involve sampling and drift. A real disturbance can also impose selection, so not every genetic change is purely random.
6. Gene Flow
Gene flow transfers alleles among populations through successful genetic contribution. In plants, pollen and seeds are major routes.
- Pollen must contribute to successful reproduction.
- Dispersed seeds must establish and contribute to the population.
Gene flow can introduce variation, counter some effects of drift, and reduce differences among populations. It can be important for isolated or inbred populations.
However, incoming alleles may be poorly suited to local conditions. Gene flow can therefore support genetic diversity while sometimes opposing local adaptation.
A restored pollinator corridor may reconnect plant populations, but its genetic benefit depends on compatible mating and successful recruitment—not simply movement between habitat patches.
7. Mutation
Mutation changes DNA and is the ultimate source of new alleles. Mutations may be harmful, neutral, or beneficial in a particular environment.
They do not arise because a plant needs a specific solution. Their evolutionary consequences depend on inheritance, chance, and reproductive success.
At an individual locus, mutation often introduces variation slowly compared with how quickly strong drift can remove it from a small population.
Mutation versus recombination
Recombination rearranges existing alleles into new combinations. It generates genotypic diversity but does not ordinarily create new alleles at a locus.
8. Natural Selection
Natural selection occurs when heritable differences affect survival or reproduction, causing variants to contribute unequally to later generations.
Unlike drift, selection is associated with fitness differences. Its effect on diversity depends on the type of selection and the environmental setting.
- Directional selection favors particular variants and can reduce diversity as they become common.
- Purifying selection removes harmful variants.
- Selective sweeps can reduce variation at a selected locus and nearby linked regions.
- Balancing selection can maintain multiple alleles.
- Different environments can favor different variants, contributing to local adaptation and differentiation.
An allele becoming fixed does not prove that it is adaptive: drift can also cause fixation. High neutral-marker diversity likewise does not prove that a population is well adapted to its current environment.
9. Comparing the Main Processes
| Process | Main action | Typical implication |
|---|---|---|
| Genetic drift | Changes frequencies through chance sampling. | Can remove variation, especially in small effective populations. |
| Bottleneck | Reduces an existing population sharply. | Can eliminate rare alleles and intensify drift. |
| Founder effect | Samples a source population through few colonists. | Can produce low diversity and unusual allele frequencies. |
| Gene flow | Transfers alleles among populations. | Can increase local variation and reduce differentiation. |
| Mutation | Introduces new alleles. | Provides the ultimate source of genetic novelty. |
| Natural selection | Changes reproductive contributions of heritable variants. | Can reduce, maintain, or redistribute variation. |
10. Important Considerations in Plant Studies
- Self-fertilization increases homozygosity, so low observed heterozygosity does not necessarily mean that few alleles are present.
- Clonal growth can produce many shoots from one genetic individual. Repeated clone sampling can distort estimates.
- Polyploid plants require methods that account for chromosome number, allele dosage, and inheritance.
- Pooling populations with different allele frequencies can produce a heterozygote deficit—the Wahlund effect.
- Seed banks preserve variation from earlier seasons, so adult-only samples may miss part of the gene pool.
Reliable comparisons use appropriate markers, comparable sampling, and uncertainty estimates. Genetic results should be interpreted alongside breeding system, dispersal, demography, and habitat history.
Summary
Hardy–Weinberg equilibrium provides a baseline for genotype proportions. Observed heterozygosity, expected heterozygosity, allelic richness, polymorphism, and nucleotide diversity describe complementary aspects of variation.
Drift can remove variants, bottlenecks and founder events intensify sampling effects, gene flow transfers alleles, mutation introduces new ones, and selection changes their reproductive contribution. No single diversity estimate identifies all these processes.
0 Comments
Have a biology question or spotted an error?
Send feedback to PreachBio →